How to Estimate Organic Traffic for a Keyword
A step-by-step method for turning a keyword into an expected number of visits a month, checked against your own Search Console data and used to decide what to write or fix first.
- Any website
- Visits within reach
- Each problem joined to its fix
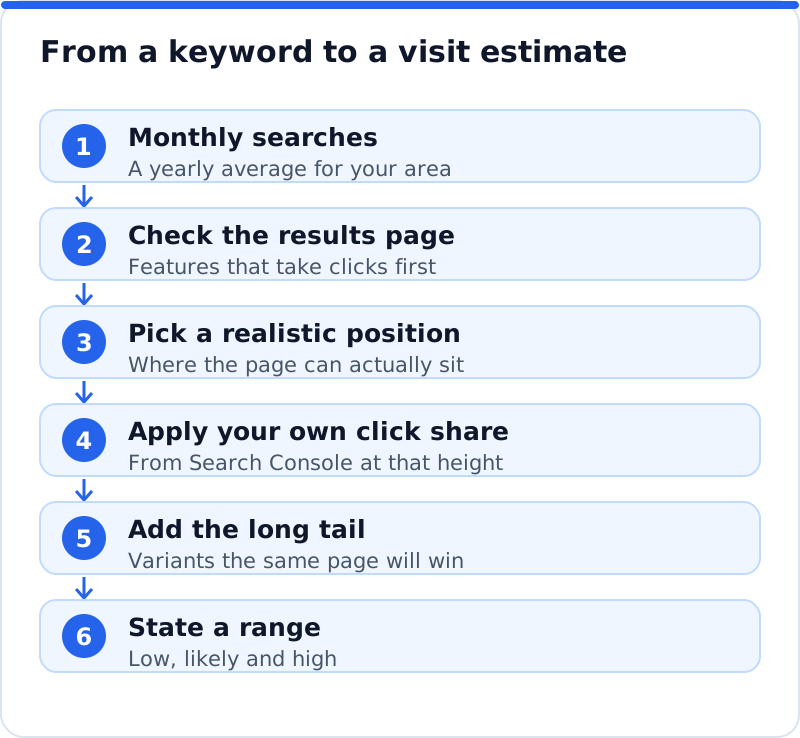
A keyword is only a guess about people until you turn it into visits, and visits are what pay for the time you spend on a page. To estimate organic traffic for a keyword, you need four things: how often people search for it, what Google shows on the results page, how many clicks a page in your likely position can expect, and the smaller related searches the same page will also win. None of those is known exactly, which is why an honest estimate is always a range rather than one confident figure. Done carefully, though, the range is precise enough to tell you whether a new page is worth writing, whether an old page is worth fixing, and which of ten ideas deserves your next spare afternoon. You will learn where each input comes from, why your own Search Console data beats any industry average, how to work through an example from start to finish, and how to use the result to set priorities.
To see your own website the way Google does, try our see your website the way Google does, part of our AI SEO Tools.
Use the AI website SEO tools to see the visits each of your main pages could win
Why estimate organic traffic one keyword at a time
Most traffic forecasts are made for a whole website, which is useful for budgets but hard to act on. An estimate for a single keyword answers a narrower and more practical question: if one page ranked well for this search, how many visits a month would it bring? That is the question you face every time you decide whether to write a page, expand one, or leave a topic alone. It also makes the estimate checkable, because once the page exists you can compare the forecast with what Search Console reports and learn how good your guesses are. Over a few rounds, your estimates improve and your choices become sharper.
Keyword estimates also add up into the bigger picture. When you estimate the main keyword for each of your important pages, the total becomes a grounded version of your website traffic potential, built from parts you can see and question. That is far more useful than a single large number from a tool, because you know which page carries which part of it. A dog groomer in Portland, for example, might discover that one page about grooming prices could bring more visits than the rest of the website combined. Knowing that before writing it changes how much care the page deserves.
Search volume and its seasonality
The first input is monthly search volume: roughly how many times people search for the keyword in the area you serve. Google Keyword Planner, inside a Google Ads account, is the standard source, although accounts with little or no ad spend see wide bands rather than exact numbers. Other keyword tools offer single figures, but those are modelled from samples and clickstream data, and two tools can disagree by several times on the same term. Keyword Planner also tends to group close variants together, so the volume for one phrase may include its plural or a different word order. Treat every volume as an order of magnitude and write it down as a band, such as "around a hundred" or "a few thousand".
Seasonality matters as much as the size. Google Trends shows how interest in a search rises and falls through the year on a relative scale, where 100 is the peak, so it shows the shape rather than the number of searches. A cycling tour company in Girona will see interest in its tours climb in late winter as people plan spring trips and fall away after summer. Estimating from the peak month would promise far more than a typical month delivers, while estimating from the low point would undersell the page. Use a yearly average for planning, and note the busy months so you publish or update the page well before they arrive.
Reading the results page before trusting the volume
Search volume counts searches, not chances to be clicked, so the next step is to look at the results page itself. Search for the keyword in a private browser window, set to the right country and ideally the right town, and note everything that appears above and around the plain results. Ads, a map with local businesses, an AI Overview, a featured snippet, a block of "People also ask" questions, a row of videos or a shopping carousel can each push the plain links down the screen. Each of them also answers some searchers before they ever reach a website. The more of these features sit above the plain links, the fewer clicks the same volume will produce.
The kind of search matters too. Searches for a business or brand name send almost all their clicks to the official website, so they are not worth estimating for anyone else. Simple factual questions, such as opening hours or a conversion, are often answered on the results page itself and send few clicks to anyone. Searches that show strong buying intent, such as a service plus a town, usually send more clicks to the plain results, but the local map can take a large share of them for nearby businesses. Write a short note beside each keyword describing the page you saw, because that note will decide how optimistic the rest of the estimate should be.
How position changes your share of clicks
The share of searchers who click a result falls steeply as you move down the page, with the first few plain results collecting most of the clicks and page two collecting very little. For a single keyword, the question is not the general shape but how steep it is on this particular results page. A results page crowded with features lowers the share every plain result receives, while a plain page of ten links leaves more clicks for the first few results. The exact shape varies from search to search, from desktop to mobile and with the features on each page, so published averages are a poor fit for any single keyword. Your title and description also move the curve, since a listing that matches the search clearly wins more than its position alone would suggest.
The most reliable click curve is your own. In Search Console, open the Performance report, show clicks, impressions, click-through rate and average position, and export the Queries tab for the last three months. Remove searches for your business name, then group the remaining queries by position, for example top three, the rest of page one, and page two, and add up clicks and impressions in each group. Dividing clicks by impressions in each group gives you the click share your own pages actually earn at each height, on the kinds of searches your business appears for. That is a far better guide than any general benchmark, because it already reflects your listings, your market and the results pages you compete on.
Counting the long tail
A page never ranks for just one search. A well-written page about a service also appears for its plurals, questions, combinations with a town or a need, and dozens of phrasings that each get only a handful of searches a month. Individually they look too small to matter, and keyword tools often show them as zero or leave them out. Together they can bring as many visits as the main keyword, sometimes more, and they are often easier to win because fewer pages compete for them. Any estimate that counts only the main keyword will usually undersell a good page.
You can gauge the long tail from your own pages. Pick a page that already ranks well, filter the Performance report to that page, and compare the clicks from its main keyword with the clicks from everything else in the Queries tab. If the other queries together match or exceed the main one, apply a similar allowance to new pages of the same kind. A mortgage broker in Glasgow might find that a page aimed at "first time buyer mortgage Glasgow" earns most of its clicks from questions about deposits, schemes and credit history. The broker would then plan new pages with the questions around the main keyword in mind, since that is where much of the traffic comes from.
A worked example
Here is the whole method applied to one keyword for a garden centre in Guildford considering a page about planting fruit trees. The numbers are invented for illustration, and every input comes from the garden centre's own research or its own Search Console data rather than a general benchmark. The keyword tools put the main search at a few hundred a month across its area, and Google Trends shows a clear peak in late autumn and winter, the bare-root planting season. The results page shows a "People also ask" box and a couple of videos above the plain results, but no ads or local map. The garden centre's own pages that sit near the top of page one on similar advice searches earned 90 clicks from 600 impressions over the last quarter.
| Step | What the garden centre found | Effect on the estimate |
|---|---|---|
| Search volume | A few hundred a month, call it 400 as a yearly average | Starting point |
| Seasonality | Strong peak from November to February | Expect most visits in winter |
| Results page | Questions box and videos, no ads or map | Slightly fewer clicks than a plain page |
| Realistic position | Near the top of page one within a few months | Use its own click share for that height |
| Own click share | 90 clicks from 600 impressions on similar pages | About 60 visits a month from the main search |
| Long tail | Its existing guides earn as much again from variants | Roughly double, then trim for the features |
| Range | Low 40, likely 90, high 130 visits a month | Worth writing before the autumn peak |
The range is deliberately wide, because each input carries its own uncertainty. The low figure assumes the page settles lower on page one than hoped and the long tail is thinner than on existing guides. The high figure assumes a strong position and a long tail as rich as the best existing page. For a decision, the likely figure is what matters, and here it says the page is worth writing and worth publishing by early autumn. If the same method had produced a likely figure of five visits a month, the garden centre would know to spend its time elsewhere.
Checking estimates and the margin of error
The first check comes before you write anything. If a page on your website already appears for the keyword, its impressions in Search Console show how often it was seen, which for a page near the top roughly tracks how often the search happens in your area. That is often a better volume figure than any keyword tool, although Search Console leaves out some rare queries to protect privacy. If impressions are far below the keyword tool's figure, the tool may be counting a wider area or grouping variants you do not rank for. Adjust the volume towards what your own data shows.
The second check comes after the page is live. Note your estimate and the date of publishing, then compare it with Search Console after about three months, and again after six, once the page has had time to settle. A ceramics studio in Amsterdam that estimated around fifty visits a month for a workshop page and saw twenty would look first at position, then at the results page, then at the listing. Each gap teaches you which input you got wrong, and the next estimate improves. Over time, your estimates will rarely be exact, but they will usually land in the right range, which is all a good decision needs.
Using estimates to choose what to write or fix first
Estimates earn their keep when you line them up. For each idea, whether a new page or an improvement to an existing one, note the likely visits, how valuable a visitor is to the business, and the effort involved. A page that improves an existing ranking usually beats a new page with the same estimate, because the ranking work is partly done and the visits arrive sooner. A keyword with fewer visits but a strong buying intent can beat a larger one that attracts browsers. Sort the list by expected value for the effort, and work from the top.
Our AI website SEO analysis gives you a starting point for that list without the spreadsheet work. It reads up to twelve of your main pages the way Google does, shows the keyword each one should win, and shows the visits a month the website gets now alongside the visits within reach. Each problem it finds is joined to the page it affects and to the tool that fixes it, with steps and the code to paste, or applied by the plugin on WordPress. Use it alongside your own keyword estimates, since the two together show both where the visits are and what is stopping you from winning them. The AI SEO tools for business websites also cover keyword research, articles and backlinks when the estimates point you towards new content.
Questions business owners ask
Why do keyword tools show such different volumes?
Each tool builds its numbers in its own way, from samples of search data, clickstream panels and modelling, and none sees Google's full figures. Google Keyword Planner is closest to the source, but it shows bands to many accounts and groups close variants together. Third-party tools may count variants separately, use different regions or update at different times. The disagreement is a reminder that volumes are approximate, not a sign that one tool is broken. Use them to compare keywords against each other, and trust your own Search Console impressions when you have them.
How long before a page reaches the estimate?
It depends on the strength of your website and the competition for the keyword. Improvements to pages that already rank can show within weeks of Google recrawling them. A new page on an established website often takes two to six months to settle into its position, and longer for competitive searches. Pages on new websites take longer still, because the website itself is still earning trust. Judge the estimate after three and six months rather than in the first few weeks.
Is it worth writing for keywords that show zero searches?
Often yes, when the topic is clearly something your customers ask about. Keyword tools show zero for many real searches simply because the numbers are too small for their samples. A page that answers a precise question can collect visits from dozens of tiny variants that no tool lists. The best evidence is your own: questions customers ask by phone or email, and queries already appearing in Search Console with a few impressions. If people ask it, there is usually someone searching for it too.
Your first five estimates
Choose five keywords this week: two for pages you already have and three for pages you are thinking about writing. For each, record the volume band, the season, what the results page shows, a realistic position and your own click share for that height from Search Console. Add an allowance for the long tail based on a similar page, and write the result as a low, likely and high range. Compare the five, pick the one with the best value for the effort, and set a date three months after publishing to check the estimate against reality. When you want the starting list done for you, use an analysis of your website to see the visits within reach and the keyword each page should win.
Your score out of 100, the visits within reach, every page read the way Google does and the tool that fixes each problem. Works on any website.
Analyse your website with AI Website SEO Tools →